Digital Power Tools
Make your tools easier, faster, and better
Tracing Go Applications
The observability ecosystem has gone through a significant evolution in the past couple of years. Both programming languages, frameworks, and observability vendors have adopted OpenTelemetry as the primary approach to collecting runtime information about applications.
In this article, I'll show you how to trace Go applications using OpenTelemetry, from basic setup to advanced techniques.
Introduction to Observability and OpenTelemetry
Observability has become a critical aspect of modern software development, especially in distributed systems. It's built on three pillars: metrics, logs, and traces.
While logs and metrics have been around for decades, distributed tracing has gained prominence with the rise of microservices architectures. Tracing allows developers to follow a request's journey across multiple services, identifying bottlenecks and understanding system behavior.
OpenTelemetry emerged as the industry standard for observability instrumentation, creating a unified, vendor-neutral framework for generating and collecting telemetry data. Its architecture consists of several key components:
- API: Defines the interfaces for instrumenting application code. These interfaces allow you to add instrumentation without any knowledge of what will happen to the instrumentation data.
- SDK: Implements the API with configurable options. After the initial instantiation, the sdk components implement the behaviors to augment, filter and export the instrumentation data to various different stores.
- Exporters: Send data to various observability backends. They are the implementation of the different vendor protocols. While many are converging on OTLP as the main communication protocol for instrumentation data, there are plenty of vendors who still maintain their own protocols. These custom exporters allow OpenTelemetry-generated data to be pushed over the custom protocols.
- Collector: An optional proxy that sits between the application and the telemetry store. The collector provides a way to collect all the traces from multiple application servers, process them (through filtering, batching, etc.) and then export the telemetry data to one or more telemetry stores.
Anatomy of an OpenTelemetry trace
An OpenTelemetry trace represents the end-to-end journey of a single logical request as it
moves through your system. A trace is composed of one or more spans that share the same
trace_id. Each span captures one operation (e.g., an incoming HTTP request handler, an outgoing
HTTP call, a DB query) and has a span_id and usually a parent_span_id that forms a
tree (or DAG when using links). The first span in a trace is commonly called the root span.
Every span contains structured data:
- Identity and timing:
trace_id,span_id, optionalparent_span_id, a name, a start time and an end time (its duration is derived from these). - Span kind: describes role in an interaction:
server,client,producer,consumer, orinternal. This helps backends render causality correctly across service boundaries. - Attributes: key/value pairs that add context to the span (e.g.,
http.method,http.route,db.system). Attributes live on spans and are the primary way to enrich telemetry for filtering and analysis. - Events: timestamped annotations within a span (e.g., "cache miss", "retry"). They are useful to capture notable moments without creating separate spans.
- Links: references to other spans (often in different traces) to model causal relationships without parent/child hierarchy, such as messaging or batch processing.
- Status: an optional final outcome for the span:
OkorError(with a description). Status is set in code (e.g.,span.SetStatus(codes.Error, ...)) and is distinct from an HTTP status code attribute likehttp.status_code. Recording an error withspan.RecordError(err)adds error details as an event; many instrumentations also set the span status toErrorfor you, but it is not guaranteed unless implemented. - Context: the span’s context carries the IDs and
trace_flags(including the sampling decision) and is propagated across process boundaries using W3Ctraceparentandtracestateheaders (or other propagators).
In addition to span-level attributes, OpenTelemetry has Resource attributes that describe the
entity producing telemetry (e.g., service.name, service.version, environment). These
are attached once to all telemetry from a process and are crucial for grouping and querying. Also related is
Baggage, which is a set of user-defined key/values propagated with the context across
services; baggage is not automatically added to spans but can be read to enrich them when appropriate.
Finally, sampling typically occurs at the root of the trace and is encoded in the trace flags. With parent-based sampling, a child span inherits the parent decision. Even when a span is not sampled for export, context propagation still happens, so downstream services can make consistent sampling decisions.
The OpenTelemetry documentation has a lot more documentation and examples on the information that is included in a trace.
Setting Up OpenTelemetry in Go
Now we know what a trace looks like, let's start by adding OpenTelemetry to a Go project. First, you'll need to add the necessary dependencies:
go get go.opentelemetry.io/otel
go get go.opentelemetry.io/otel/sdk
go get go.opentelemetry.io/otel/trace
go get go.opentelemetry.io/otel/exporters/otlp/otlptrace/otlptracegrpc
Next up, you've got to initialize the OpenTelemetry SDK in your application, telling it which traces to collect and where to send them. The setup consists of a couple of distinct steps:
- Create a resource with additional information about your application. This usually includes at least the name and a version number. The example has it hardcoded, but you can inject it at build time as well.
- Create an exporter that forwards the traces to an OpenTelemetry Collector via gRPC.
- Set up the trace provider, which will act as the entrypoint to create new spans and traces. In this example, it's configured to always sample traces, which is suitable for development but may be too verbose for production.
- Set up context propagation for distributed tracing across multiple services.
package main

import (
    "context"
    "log"
    "time"

    "go.opentelemetry.io/otel"
    "go.opentelemetry.io/otel/exporters/otlp/otlptrace/otlptracegrpc"
    "go.opentelemetry.io/otel/propagation"
    "go.opentelemetry.io/otel/sdk/resource"
    sdktrace "go.opentelemetry.io/otel/sdk/trace"
    semconv "go.opentelemetry.io/otel/semconv/v1.4.0"
    "google.golang.org/grpc"
)

func initTracer() func() {
    // Create a resource describing the service
    res, err := resource.New(context.Background(),
        resource.WithAttributes(
            semconv.ServiceNameKey.String("my-service"),
            semconv.ServiceVersionKey.String("1.0.0"),
        ),
    )
    if err != nil {
        log.Fatalf("Failed to create resource: %v", err)
    }

    ctx, cancel := context.WithTimeout(context.Background(), 5*time.Second)
    defer cancel()

    // Create an exporter that connects to the collector
    exporter, err := otlptracegrpc.New(ctx,
        otlptracegrpc.WithEndpoint("localhost:4317"),
        otlptracegrpc.WithInsecure())
    if err != nil {
        log.Fatalf("Failed to create exporter: %v", err)
    }

    // Create a trace provider
    tp := sdktrace.NewTracerProvider(
        sdktrace.WithSampler(sdktrace.AlwaysSample()),
        sdktrace.WithResource(res),
        sdktrace.WithBatcher(exporter),
    )
    otel.SetTracerProvider(tp)

    // Set up propagation
    otel.SetTextMapPropagator(propagation.NewCompositeTextMapPropagator(
        propagation.TraceContext{},
        propagation.Baggage{},
    ))

    return func() {
        ctx, cancel := context.WithTimeout(context.Background(), 5*time.Second)
        defer cancel()
        if err := tp.Shutdown(ctx); err != nil {
            log.Fatalf("Failed to shut down tracer provider: %v", err)
        }
    }
}

func main() {
    cleanup := initTracer()
    defer cleanup()

    // Your application code here
}
Instrumenting Go Applications
With OpenTelemetry initialized, you can now instrument your own code to create traces. Let's look at how to create spans using a tracer, how to create child spans for nested operations by using the Context and how to add attributes, events, and errors:
package main

import (
	"context"
	"log"
	"net/http"
	"time"

	"go.opentelemetry.io/otel"
	"go.opentelemetry.io/otel/attribute"
	"go.opentelemetry.io/otel/exporters/otlp/otlptrace/otlptracegrpc"
	"go.opentelemetry.io/otel/propagation"
	"go.opentelemetry.io/otel/sdk/resource"
	sdktrace "go.opentelemetry.io/otel/sdk/trace"
	semconv "go.opentelemetry.io/otel/semconv/v1.34.0"
	"go.opentelemetry.io/otel/trace"
)

var tracer trace.Tracer

func handleRequest(w http.ResponseWriter, r *http.Request) {
	// Extract the context from the HTTP request
	ctx := r.Context()

	// Create a span
	ctx, span := tracer.Start(ctx, "handleRequest")
	defer span.End()

	// Add attributes to the span
	span.SetAttributes(
		attribute.String("http.method", r.Method),
		attribute.String("http.url", r.URL.String()),
	)

	// Simulate some work
	processRequest(ctx)

	// Record an event
	span.AddEvent("request processed")

	w.Write([]byte("Hello, world!"))
}

func processRequest(ctx context.Context) {
	// Create a child span
	_, span := tracer.Start(ctx, "processRequest")
	defer span.End()

	// Simulate work
	// ...

	// Record an error if something goes wrong
	span.RecordError(err)
	span.SetStatus(codes.Error, "processing failed")
}

func main() {
	// Initialize tracer (from previous example)
	cleanup := initTracer()
	defer cleanup()

	tracer = otel.Tracer("my-service")

	http.HandleFunc("/", handleRequest)
	log.Fatal(http.ListenAndServe(":8080", nil))
}
Tracing in local development
Obviously, you don't just want to push any code to for code review without testing it out locally. Luckily, it's pretty easy to spin up a simple tracing stack locally using Docker and Jaeger. Create the docker file and the collector config file side-by-side and run docker compose up -d. The collector will accept tracing data on the default endpoint localhost:4317. Jaeger will be available at http://localhost:16686 to inspect the traces.
docker-compose.yaml
version: "3.9"
services:
  otel-collector:
    image: otel/opentelemetry-collector-contrib
    command: ['--config=/etc/otel-collector.yaml']
    ports:
      - "4317:4317"
    volumes:
      - ./otel-collector.yaml:/etc/otel-collector.yaml
    depends_on:
      - jaeger

  jaeger:
    image: jaegertracing/all-in-one
    ports:
      - "16686:16686"
collector-config.yaml
receivers:
  otlp:
    protocols:
      grpc:
        endpoint: "0.0.0.0:4317"
processors:
  batch:
  # https://github.com/open-telemetry/opentelemetry-collector/tree/main/processor/memorylimiterprocessor
  memory_limiter:
    # 75% of total memory
    limit_percentage: 75
    check_interval: 1s
extensions:
  health_check: {}
exporters:
  otlp:
    endpoint: "jaeger:4317"
    tls:
      insecure: true
  debug:
    verbosity: detailed

service:
  extensions: [health_check]
  pipelines:
    traces:
      receivers: [otlp]
      processors: [memory_limiter, batch]
      exporters: [otlp]
Tip: During development, keep the OTLP exporter behind a feature flag or env var that is off by default. You can switch it on when you want to analyze full local trace graphs in Jaeger. And if you just want a quick glance at the traces in the terminal, you can termporarily swap out the OTLP exporter with the stdouttrace exporter.
Automatic Instrumentation
While manual instrumentation gives you complete control over the information you track, OpenTelemetry also provides automatic instrumentation for many popular Go libraries and frameworks. For example, to instrument HTTP clients and servers, there's the otelhttp package that adds HTTP specific attributes to spans:
import (
    "net/http"

    "go.opentelemetry.io/contrib/instrumentation/net/http/otelhttp"
)

// Instrument an HTTP client
client := http.Client{
    Transport: otelhttp.NewTransport(http.DefaultTransport),
}

// Instrument an HTTP server
handler := http.HandlerFunc(handleRequest)
http.Handle("/", otelhttp.NewHandler(handler, "server"))
Similar instrumentation exists for gRPC, SQL databases, Redis, and many other common libraries.
Context Propagation
One of the most powerful aspects of distributed tracing is the ability to track requests across service boundaries. OpenTelemetry handles this through context propagation:
func callDownstreamService(ctx context.Context) {
    // Create a span for the outgoing request
    ctx, span := tracer.Start(ctx, "callDownstream")
    defer span.End()

    // Create an HTTP request with the current context
    req, _ := http.NewRequestWithContext(ctx, "GET", "http://downstream-service/api", nil)

    // The otelhttp client will automatically inject trace context into the request headers
    client := http.Client{
        Transport: otelhttp.NewTransport(http.DefaultTransport),
    }
    resp, err := client.Do(req)
    if err != nil {
        span.RecordError(err)
        return
    }
    defer resp.Body.Close()

    // Process response
    // ...
}
When the downstream service receives this request, it can extract the trace context and continue the same trace, creating a complete picture of the request's journey.
Advanced Tracing Techniques
Sampling Strategies
In the first example where OpenTelemtry was initialized, we used the AlwaysSample strategy. This works great in development, where you want to see pretty much every trace. In production environments, tracing every request can generate overwhelming amounts of data, which is why OpenTelemetry provides various sampling strategies. The example below will select only 10% of the traces that do not have a parent trace, otherwise it uses that decision.
// Sample 10% of traces
sampler := sdktrace.ParentBased(
    sdktrace.TraceIDRatioBased(0.1),
)

// Create a trace provider with the sampler
tp := sdktrace.NewTracerProvider(
    sdktrace.WithSampler(sampler),
    // other options...
)
Other sampling strategies include:
AlwaysSample(): Samples every trace (good for development)NeverSample(): Samples no tracesParentBased(): Respects the parent span's sampling decision
These sampling strategies will apply the trace selection inside the application, which may not always give you the result that you expect. Since the selection happens at the start of the trace, it may drop traces with an error status or traces that end up taking too long. This may not be an issue if you get a lot of traffic or the problems occur in more than 10% of the traces. If you want to make sure you get all errors and slow traces, use the AlwaysSample strategy, forward the traces to the collector and apply the tail sampling processor with the latency and status_code policies.
Custom Span Processors
A less commonly used feature of OpenTelemetry are the custom span processors. These allow you to intercept spans before they're exported, giving you the opportunity to add extra information or perform other actions based on trace data:
type customProcessor struct {
    next sdktrace.SpanProcessor
}

func (p *customProcessor) OnStart(ctx context.Context, s sdktrace.ReadWriteSpan) {
    // Add custom attributes to all spans
    s.SetAttributes(attribute.String("environment", "production"))

    // Call the next processor
    p.next.OnStart(ctx, s)
}

func (p *customProcessor) OnEnd(s sdktrace.ReadOnlySpan) {
    // Custom logic when spans end
    if s.Name() == "database.query" {
        // Log slow queries
        if s.EndTime().Sub(s.StartTime()) > time.Second {
            log.Printf("Slow query detected: %s", s.Name())
        }
    }

    // Call the next processor
    p.next.OnEnd(s)
}

func (p *customProcessor) Shutdown(ctx context.Context) error {
    return p.next.Shutdown(ctx)
}

// Add the custom processor to the trace provider
tp := sdktrace.NewTracerProvider(
    sdktrace.WithSpanProcessor(&customProcessor{next: sdktrace.NewBatchSpanProcessor(exporter)}),
    // other options...
)
Integration with Observability Backends
So far, none of the code contains anything specific to one vendor or another. The only mention of an observability store was the jaeger config in the docker-compose file. And that's the ideal world, you shouldn't have to make code changes to change your observability store. Most of the common stores have an exporter available that can be configured through the collector configuration file. However, if you're running a small single-server service and you don't want the operational overhead of the collector, OpenTelemetry can export traces to various backends directly from code. Here are some packages that implement exporters for common stores, including both self-hosted options like zipkin and jaeger as well as the major cloud providers:
                "go.opentelemetry.io/otel/exporters/zipkin"
                "go.opentelemetry.io/otel/exporters/jaeger"
                "go.opentelemetry.io/contrib/propagators/aws/xray"
                "cloud.google.com/go/trace/apiv2"
In the collector, there's a big list of supported exporters including popular services like DataDog, ElasticSearch and HoneyComb that can all be used to receive OpenTelemetry data. If your favority platform is not listed there, search around, it may support the native OTLP protocol. Note that I'm not making any recommendation on which platform to choose. Everyone's requirements are different, and there are plenty of variables to consider like price, features and operational capabilities.
Best Practices and Performance Considerations
When implementing tracing in your Go applications, consider these best practices. They will help you improve searchability and manage the cost of your observability setup.
- Use consistent naming conventions: Follow the format
<component>.<operation>(e.g.,http.request,database.query). Read the OpenTelemetry spec on naming and semantic conventions for common attributes and more guidelines. - Add meaningful attributes: Include information that helps with debugging and analysis, like id's of database records, but avoid sensitive data like passwords, access tokens and PII.
- Handle errors properly: Always record errors in spans and set appropriate status codes. Spans with errors are often highlighted in observability tools like Jaeger.
- Implement proper context propagation: Always pass context through your application to maintain trace continuity.
- Be selective about what you trace: Not every function needs a span. Focus on boundaries, I/O operations, and critical business logic.
- Consider performance impact: Use sampling in production and be mindful of the overhead introduced by tracing.
- Set appropriate timeouts: For exporters and shutdown operations to prevent hanging.
Tracing a full REST API
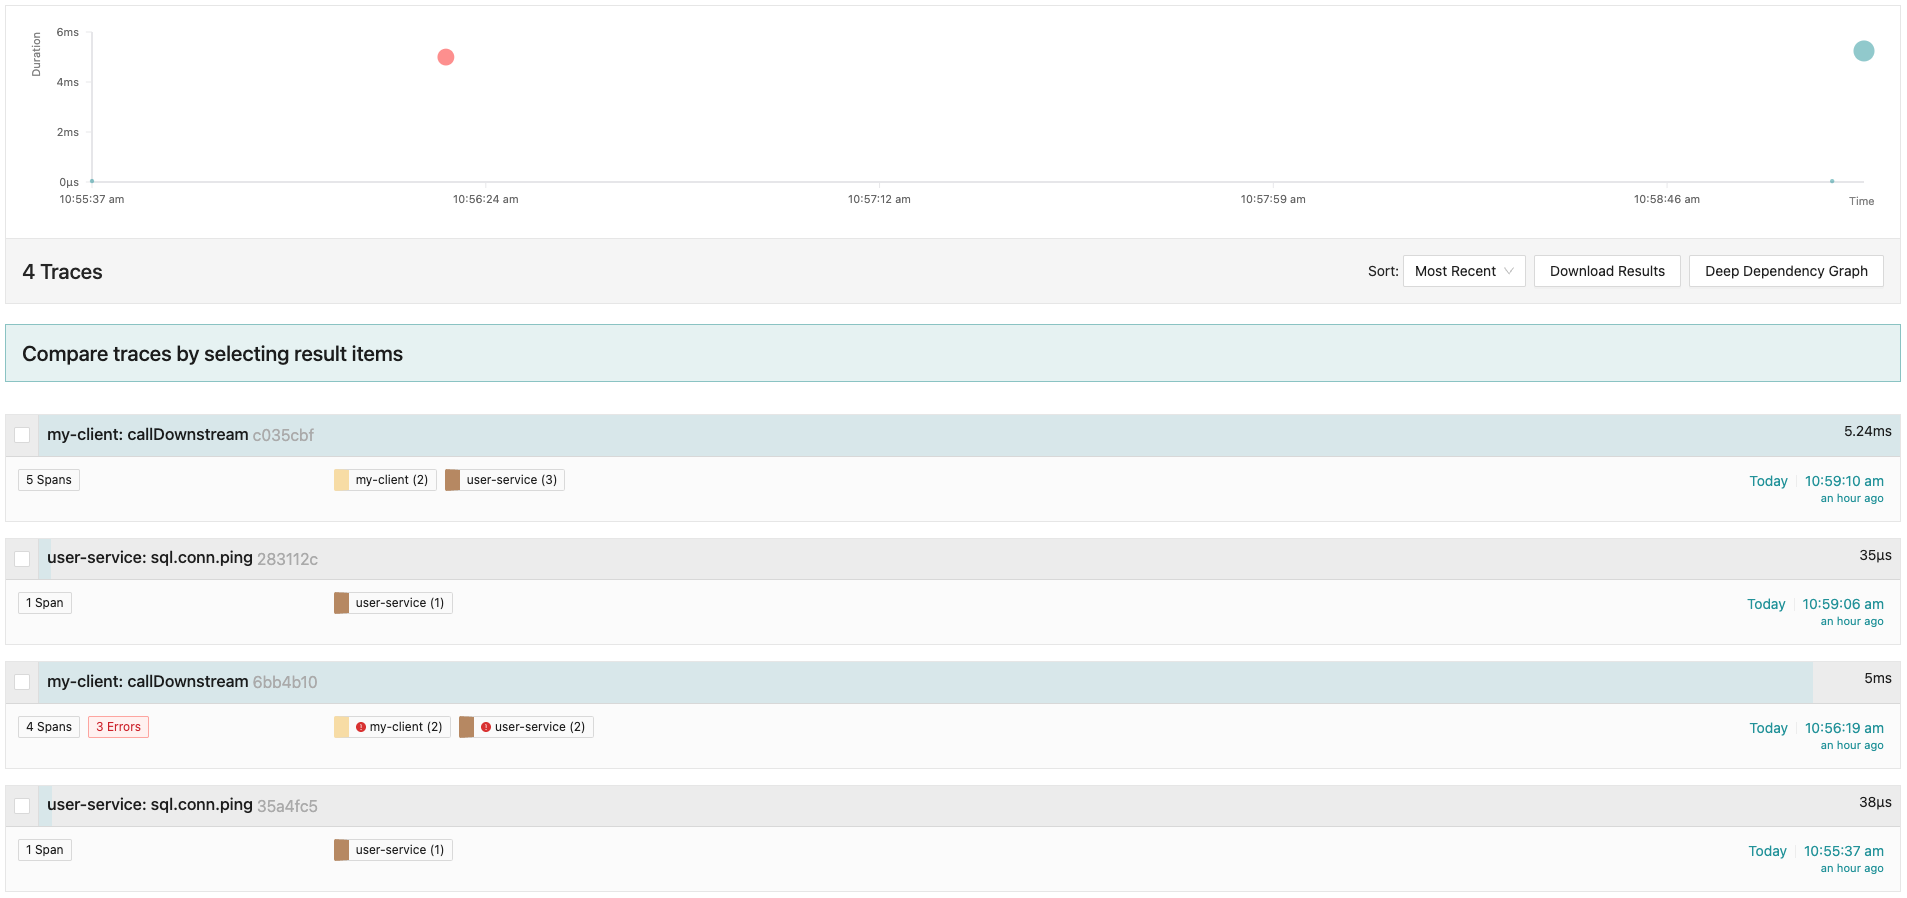
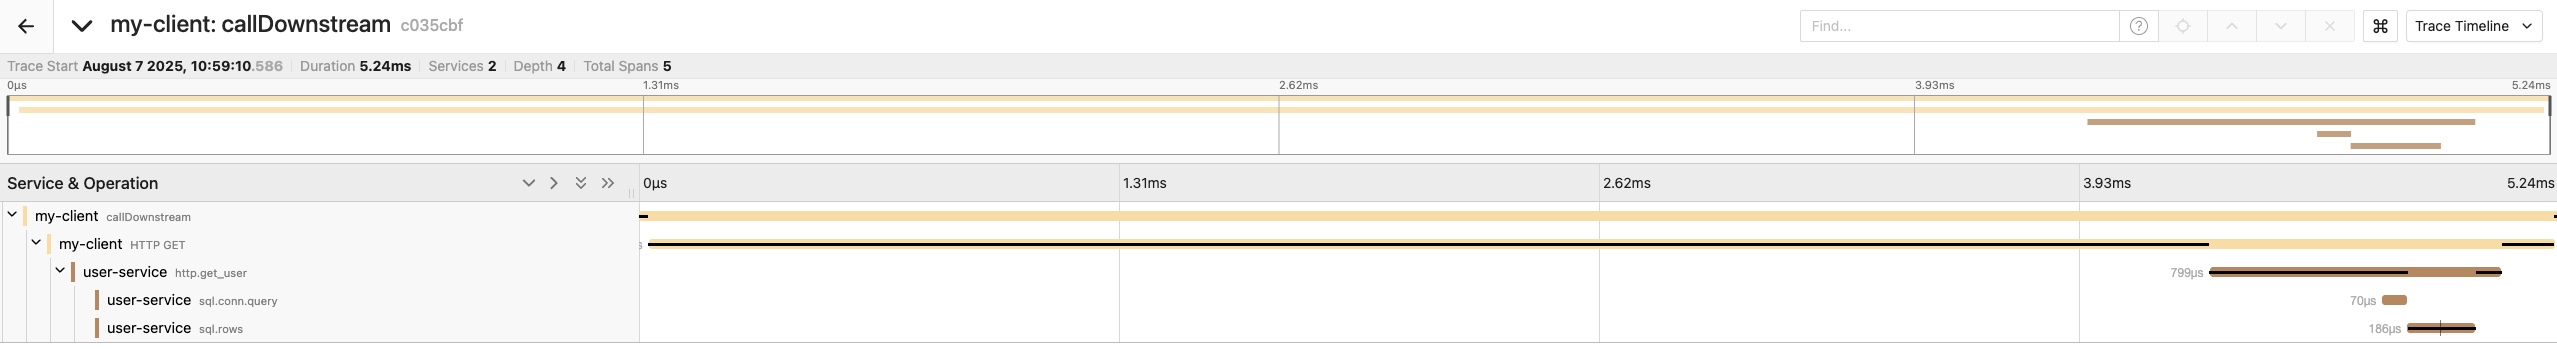
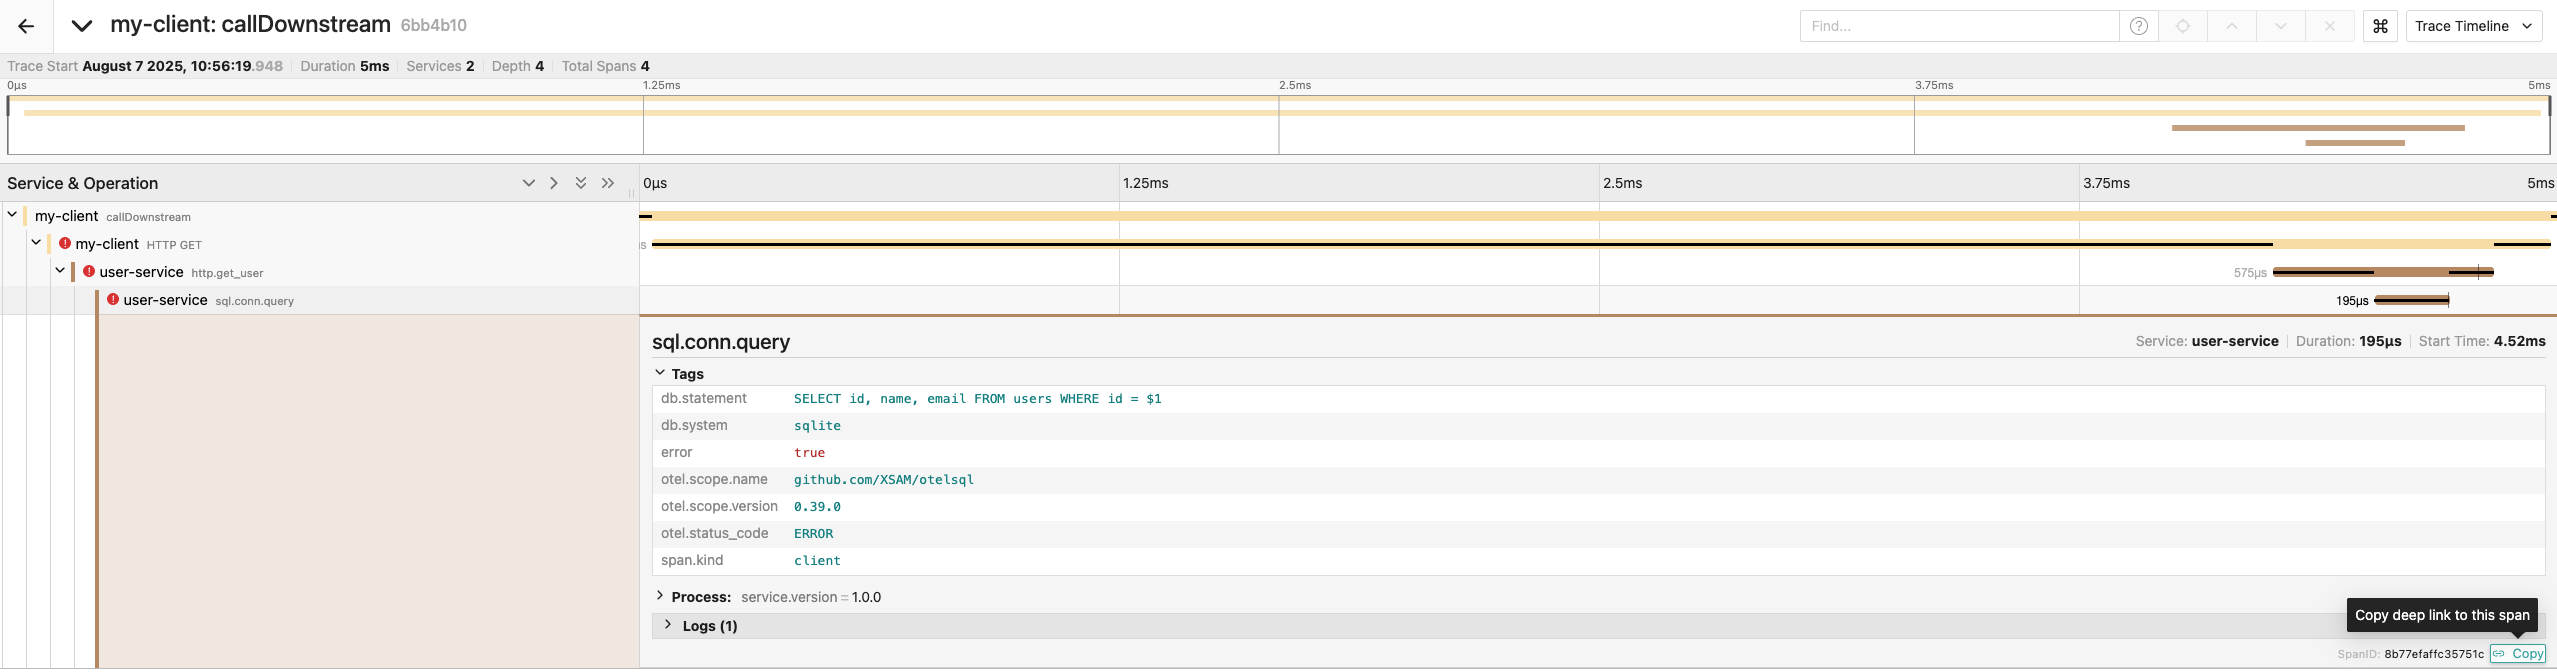
I've collected all the code samples from this article into a single repository and added a service that has many of the components that you would have in a production system. The service can be run with go run main.go in the rest-api directory, and the downstream code can be used to query it. If you're running the local docker-compose setup, the traces for the downstream and rest-api will be available in the Jaeger interface at http://localhost:16686 . I'm not going to include the code here directly, but here are the concepts that are used:
- Setting up a complete tracing pipeline
- Instrumenting HTTP handlers
- Using otelsql for automatic SQlite instrumentation
- Adding meaningful attributes to spans
- Handling errors properly
Here are a couple of screenshots from my local Jaeger running this rest API:
Troubleshooting Common Issues
When working with OpenTelemetry in Go, you might encounter these common issues:
No Traces Appearing in Backend
- Check that the exporter is configured correctly with the right endpoint
- Verify that the collector is running and accessible
- Ensure spans are being ended properly with
defer span.End() - Check sampling configuration (you might be sampling out all traces)
Broken Trace Context
- Ensure context is being properly propagated through all function calls
- Check that HTTP clients and servers are properly instrumented
- Verify that the correct propagators are configured
High Overhead
- Adjust the sampling rate to reduce the number of traces
- Use batch processors instead of simple processors
- Be selective about what operations you trace
- Limit the number of attributes and events added to spans
Conclusion
Implementing distributed tracing with OpenTelemetry in Go applications provides powerful insights into system behavior and performance. By following the patterns and practices outlined in this article, you can build a robust observability solution that helps you understand, debug, and optimize your distributed systems.
OpenTelemetry's vendor-neutral approach ensures that you're not locked into any specific observability backend, giving you the flexibility to choose the tools that best fit your needs.
If you want an example OpenTelemetry setup, check out the otel package in my Go web framework Tracks.
Are you looking for help to get your team to the next level in terms of observability and performance? Get in touch to get the traces flowing.
In any case, make sure you follow me on 𝕏 or LinkedIn to catch the next article on the next pillar of observability: Measuring Go Applications.
Want to read more? Check out my previous post Celebrating Craftsmanship